Impact
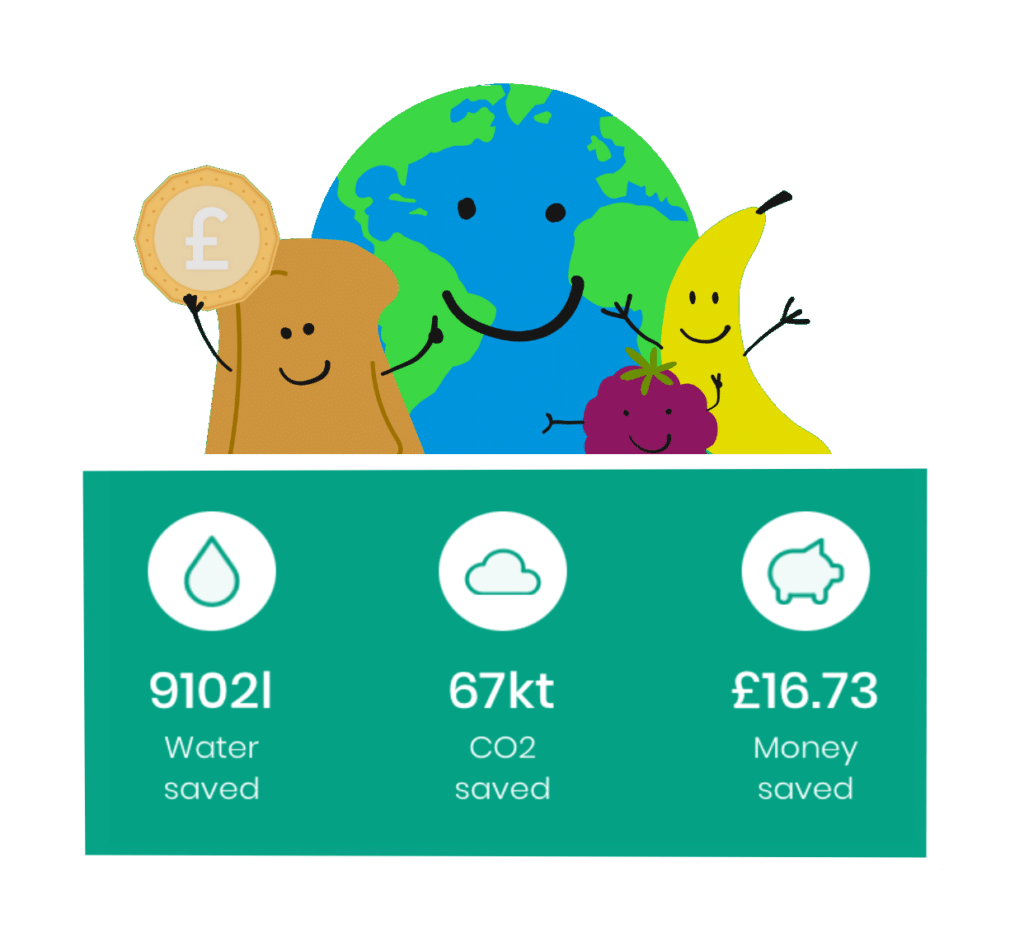
Water, CO2 and money saved
How do you calculate my water, CO2 and money saved?
Calculating how much you have saved through food waste prevention is not an easy task and we rely on some basic assumptions:
- We assume that you (a household) would spend the national average on food waste each week and throw away the average weight of food waste each week if you were not using Kitche
- We also assume that you are reporting all of the food you waste each week (not just some of it)
- We assume that if don’t interact with the app and ditch a product over a week that you have not been using the app to record your waste. (This is because even the best food waste warriors waste some food each week). In this case your saved figures won’t change.
We use the following calculations, which aggregate (add up) each week with the previous weeks’ data.
- £ saved = national average £/ week- user spend / week
- CO2 saved = national average CO2/ week- user CO2 / week
- Water saved = national average water /week – user water / week
Below you can see where we source the national average stats from. There are a lot of different methodologies and studies out there and we want to update our calculations to the most current and reliable figures so please share any relevant research with us: hello@kitche.co
How do we calculate the national average spend, CO2 emissions and water usage associated with food waste?
- A household’s national average spend on food waste each day is £1.36 ∴ £9.52 per week (based on households average waste for a year is £496)
- The national average weight of a households food waste each day is 1.96kg ∴ 13.72kg per week
- The national average amount of water wasted from food waste each day for one person is 280l ∴ 1960l per week. If we assume that there are on average 2.36 people per household then each household wastes on average 4623l per week.
- The national average CO2 can be calculated using weight, we assume that for every 1kg of food wasted, there are 2.5kg of emissions. ∴ therefore the average CO2 emissions from food waste for an average UK household is 34.3kg.
How do we calculate your spend, CO2 emissions and water usage associated with food waste?
- If you scan your receipts we extract the price of your product. If you enter products manually, using barcode, recommendations or audio input we use proxy prices drawn from an internal database that is continually updated as prices change
- For CO2 and water usage associated with food waste we use the weight of the food you have thown away (assuming that an average product weighs 0.45kg).
User CO2/ week = user kg wasted per week x 2.5kg
User Water/ week = user kg wasted per week x 337.14l
Why does it sometimes say I have saved £0 but I have saved x water and CO2 (or visa versa)?
This happens because we are using averages as estimates to calculate the saved figures. The price of products vary and do not depend on the weight of the product, whereas the CO2 and water usage associated with food waste depends on the weight of the food thrown away! Just keep in mind that these numbers are there to give you an idea of the positive impact you are having and are not totally accurate!
If you have any questions please feel free to send an email, we are always happy to talk numbers: hello@kitche.co
Summary
This is where you can track your progress week by week and see the positive impact your are having on the planet and your pocket!
You can personalise your page by choosing an avatar and setting a personal goal (e.g. stop wasting bread). You can also change the name at the top of your Impact page in the Account tab (Account Settings -> Household information -> Profile name)
First you will see how much water, CO2 and money you have saved. (if you want to understand how these figures are calculated click the tutorial above ‘Water CO2 and money saved’)
You also have a progress bar that tells you how long you have been using the app. Once you have completed the progress bar you will get an award and the bar will reset. Exciting!
Next is your food waste summary that gives you the total cost and amount of products you have wasted this week, and last week.
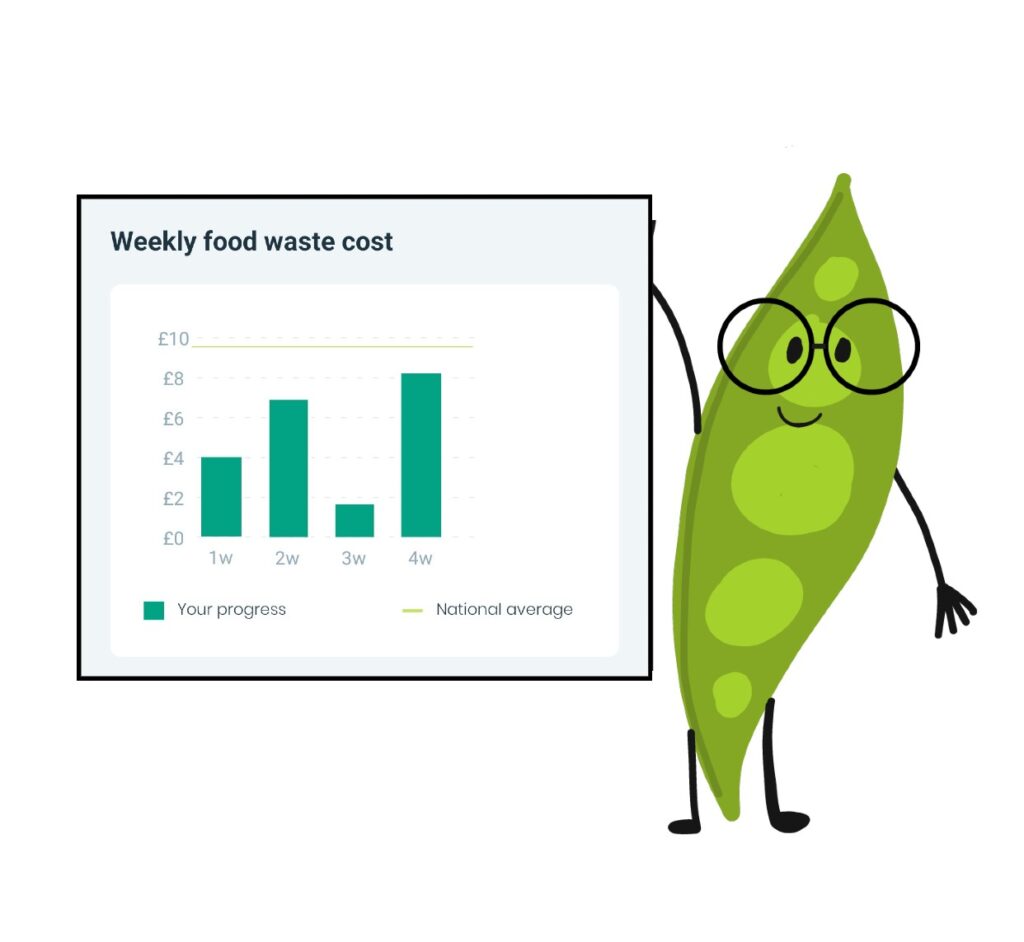
We also have the weekly food waste cost graph where you can see your progress and how you compare to the national average every week!
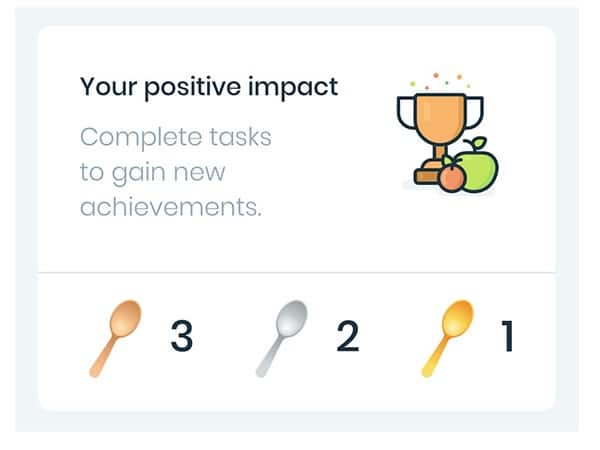
Awards
The Awards section is where you can keep track of your goals and achievements in the app. At the top of the page you can see how many spoons you have been awarded.
You win bronze, silver and gold spoons for Launching Kitche, Adding products, Scanning receipts, Selecting recipes and Swiping to record your waste. Find out what Goals you have on the right hand tab and your Achievements on the left hand tab. When you are awarded an Impact award you can share it on your social media accounts!